Repeated measurements and dimensional chains answer different questions. Repeated readings describe the variation observed when measuring one quantity from the same reference. A dimensional chain combines different signed dimensions to obtain another dimension. This reference shows how to prepare both input types, calculate their results, and keep observed variation separate from a supplied allowable bound.
Choose the record that matches the question
| Your task | Suitable tool | What you must supply |
|---|---|---|
| Summarize repeated readings | Repeated measurement statistics | 2–50 readings of the same dimension, one per line, in one common unit |
| Add signed nominal dimensions and symmetric bounds | Dimensional chain bounds | 1–50 rows, each containing a signed nominal and nonnegative absolute bound |
| Add positive measured layers | Stacked thickness | 1–20 positive layer thicknesses, with each row’s unit |
| Compare a measurement with a target or supplied limits | Dimensional comparison | The same quantity and reference, target, and optional complete interval |
Do not mix a bore diameter and a backset as repeated readings. Do not infer a chain bound from the display precision of an unrelated instrument. If a bound is unknown, obtain the necessary information rather than entering zero.
Prepare repeated readings consistently
Identify the dimension, its start and end references, measurement direction, instrument, and unit. Keep location and setup constant for one series. If the reference or setup changes, start a separate series and note why. Preserve the original readings so that a summary can be checked later.
In the statistics tool, select inches or millimeters and put one reading on each line. Signed readings are supported for quantities such as offsets. Inch entries may use supported fractions; millimeter entries use decimals. The sample standard deviation requires at least two readings. The tool does not establish instrument calibration, remove bias, or distinguish measurement error from actual changes in the part.
Worked example: three readings
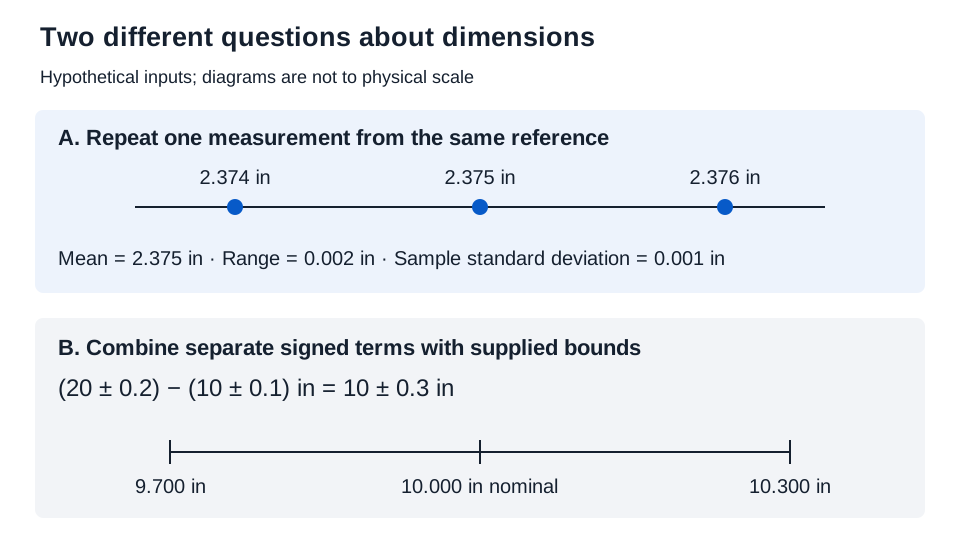
Inputs: inches selected; readings 2.374, 2.375, and 2.376, one per line.
Mean = (2.374 + 2.375 + 2.376)/3 = 2.375 in
Observed range = maximum − minimum = 2.376 − 2.374 = 0.002 in
The deviations from the mean are −0.001, 0, and +0.001 in. Their squared sum is 0.000002 in². Sample standard deviation divides that sum by n − 1, rather than n:
s = √[0.000002/(3 − 1)] = 0.001 in
Results: mean 2.375 in, range 0.002 in, and sample standard deviation 0.001 in. At three decimal places none changes. Their millimeter equivalents are 60.325 mm, 0.0508 mm, and 0.0254 mm; displayed to three places, the latter two become 0.051 mm and 0.025 mm. The tool retains unrounded values until display. A small standard deviation does not prove that the mean is the true dimension or lies within an allowable interval.
Build a signed chain without canceling its bounds
Write the physical equation first. Give subtracted dimensions negative nominal signs, but keep each symmetric absolute bound nonnegative. The calculator adds those bounds regardless of the nominal signs.
Worked example: a difference of two bounded dimensions
Inputs: inches selected; rows 20, .2 and -10, .1. These mean 20 ± 0.2 in minus 10 ± 0.1 in. All bounds are hypothetical supplied values.
Nominal result = 20 + (−10) = 10 in
Total absolute bound = 0.2 + 0.1 = 0.3 in
Lower result = 10 − 0.3 = 9.7 in
Upper result = 10 + 0.3 = 10.3 in
An independent endpoint check gives the same answer: 19.8 − 10.1 = 9.7 and 20.2 − 9.9 = 10.3. Displayed results: nominal 10.000 in, lower 9.700 in, upper 10.300 in.
This is a worst-case interval calculation. It does not assign probabilities to the endpoints or use a statistical root-sum-square model. The negative second nominal does not subtract its uncertainty bound.
Keep the interpretation with the result
Record the source of every bound, the drawing revision, the common unit, and the physical references. Keep the statistical summary and chain calculation in separate records even if they concern the same assembly. Display rounding is neither a measurement uncertainty estimate nor a manufacturer’s tolerance.
Conclusion
Use repeated-reading statistics to describe a measured series. Use chain bounds to propagate explicitly supplied limits through a signed sum. Compare either result with applicable product requirements only after confirming that the quantities and references match.
Basis
NIST/SEMATECH’s measures of variability defines the observed range and sample standard deviation. The chain follows direct interval addition. Length conversions use the exact unit relationships. Neither calculation selects hardware or establishes installation approval.