A DC budget must identify where current is measured, which loads operate together, and how long each state lasts. Current on a converter’s output side is not generally the same as current at its source. A simultaneous load budget is also different from a chronological charge calculation. This reference keeps those distinctions visible through completed examples.
Draw the electrical boundary first
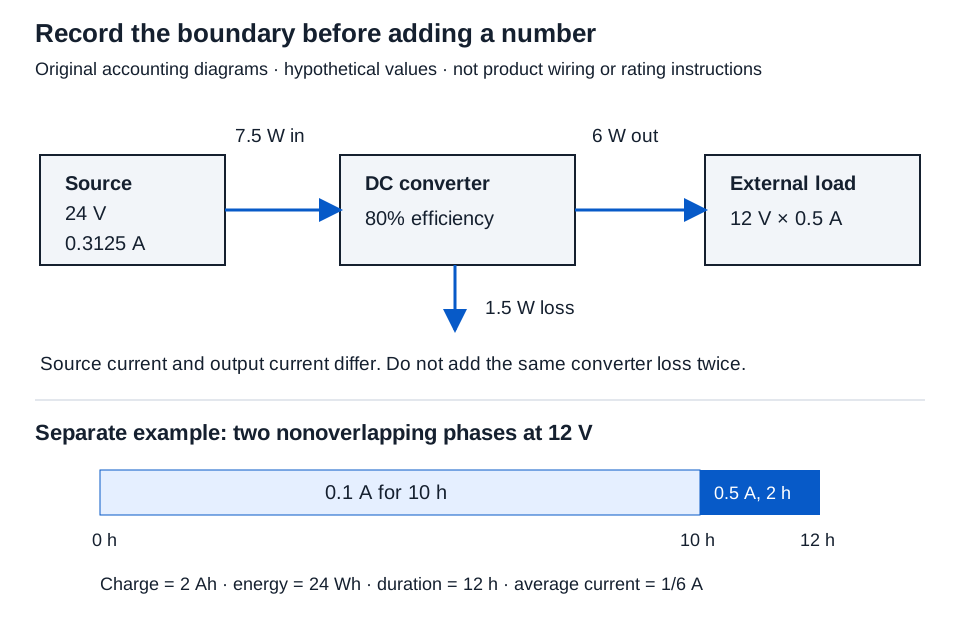
Identify the source voltage, devices on that source, converter locations, and equipment inside the cabinet. For each device, retain the product data and operating state that support its current. Keep source-side current, output-side current, delivered power, and internal loss in separate columns.
Add devices within each simultaneous scenario
The DC load budget calculator accepts one positive supply voltage, two described scenarios, and 1–20 load rows. Each row needs a name, whole-number quantity 1–1,000, and nonnegative per-device current in each scenario. Use decimal amperes, not milliamperes: 250 mA = 0.250 A.
Example inputs: source 24 V; scenario A, “both devices in the stated low-current condition”; scenario B, “both devices in the stated high-current condition.” These descriptions are assumptions, not inferred startup behavior.
| Load group | Quantity | Scenario A, each (A) | Scenario B, each (A) | A subtotal (A) | B subtotal (A) |
|---|---|---|---|---|---|
| Hypothetical device group | 2 | 0.10 | 0.50 | 0.20 | 1.00 |
| Hypothetical controller | 1 | 0.15 | 0.15 | 0.15 | 0.15 |
Scenario A current = 2 × 0.10 + 0.15 = 0.350 A
Scenario A power = 24 × 0.35 = 8.400 W
Scenario B current = 2 × 0.50 + 0.15 = 1.150 A
Scenario B power = 24 × 1.15 = 27.600 W
Do not add the two scenario totals; they describe alternative stated conditions. Supply reserve, charging current, derating, transient timing, output limits, and product selection require their own evidence. The DC Ohm’s law tool can derive quantities for one supported operating point, but it does not establish that an electronic lock behaves as a constant resistor in every state.
Account for converter input and loss once
In the converter load calculator, supply positive source and output voltages, nonnegative output current, and efficiency greater than zero and no more than 100%. Efficiency must apply to the stated operating point.
Example inputs: output 12 V at 0.5 A, efficiency 80%, source 24 V.
Output power = 12 × 0.5 = 6 W
Source power = 6/0.80 = 7.5 W
Source current = 7.5/24 = 0.3125 A
Converter loss = 7.5 − 6 = 1.5 W
Displayed results: 6.000 W, 7.500 W, 0.313 A, and 1.500 W. Use 0.3125 A, not the rounded 0.313 A, in a subsequent source budget. That source current already includes the converter loss; adding the loss again as source demand would count it twice. Do not add the 0.5 A output current directly to a 24 V source-side current total.
Keep cabinet heat inside its physical boundary
For enclosure heat loss, enter direct internal losses as quantity, watts each and converter rows as quantity, output watts each, efficiency percent. Each table supports 1–30 rows; quantities are whole numbers 1–1,000. Use a zero-watt row when a required table has no contribution. Count only heat actually released inside the enclosure.
With two 1 W internal devices and one converter delivering 6 W at 80%, heat is:
Internal heat rate = 2 × 1 + 1 × 6 × (1/0.80 − 1) = 3.500 W
Energy in one hour = 3.5 × 3,600/1,000 = 12.600 kJ
Equivalent heat rate = 3.5 × 3,600/1,055.05585262 ≈ 11.942 BTU_IT/h
The converter’s 6 W delivered to an external load is not internal cabinet heat. Do not enter its 1.5 W loss as a direct row as well as a converter row. Heat rate does not by itself predict cabinet temperature.
Keep PoE port allocations with the output pool
Identify the power sourcing equipment (PSE), its configuration and firmware, its budgeting policy, and the source for its available output pool. Keep all port values at that same PSE output boundary. The following completed example uses a hypothetical 80 W pool; these are not product ratings.
| Physical port | Output cap (W) | Allocation (W) | Required PSE-side allowance (W) | Allocation minus requirement (W) |
|---|---|---|---|---|
| Port 1, hypothetical | 30 | 20 | 18 | +2 |
| Port 2, hypothetical | 30 | 30 | 24 | +6 |
The PoE allocation budget calculator checks a supplied static plan at both port and pool levels. Record PSE-side values: PD consumption and an AC input rating are different boundaries. For a hypothetical 80 W output pool, allocations of 20 W and 30 W use 50 W, leaving 30 W; each port still needs its own output-cap and required-allowance check. Unknown allocation is not zero or the present consumption reading. This record does not determine negotiation, startup order, or equipment compatibility.
Record a chronological load schedule
The DC timeline calculator accepts 1–30 nonoverlapping phases, each as decimal hours, whole-system amperes, volts. Use the same electrical boundary throughout. Include off periods when their duration belongs in the average; individual entries can be zero, but total duration must be positive.
Example inputs: 10, 0.1, 12 followed by 2, 0.5, 12.
| Phase | Duration (h) | Whole-system current (A) | Voltage (V) | Charge (Ah) | Energy (Wh) |
|---|---|---|---|---|---|
| First period | 10 | 0.1 | 12 | 1.000 | 12.000 |
| Second period | 2 | 0.5 | 12 | 1.000 | 12.000 |
| Total | 12 | Varies by phase | 12 | 2.000 | 24.000 |
Charge = 10 × 0.1 + 2 × 0.5 = 2 Ah
Average current = 2/12 = 1/6 A, displayed as 0.167 A.
Several devices operating during the same hours are simultaneous loads, not successive phases. Add their currents within that phase before entering the row.
Choose the storage model that matches the inputs
| Tool | Hypothetical inputs and calculation | Result | Main limitation |
|---|---|---|---|
| Ideal constant-current battery | 7 Ah / 0.5 A | 14.000 h | Assigned usable charge and constant battery-side current; no real discharge prediction |
| Identical nominal battery bank | 12 V, 7 Ah units; 2 series × 2 parallel | 24.000 V, 14.000 Ah, 336.000 Wh, 4 units | Nominal arithmetic only, not connection or charging instructions |
| Ideal capacitor hold | 0.1 A × 0.1 s / 1 V drop | 0.010 F = 10,000.000 µF | Direct constant-current discharge; no converter, ESR, or leakage |
Amp-hours measure charge; watt-hours measure energy. A voltage and electrical boundary are necessary to relate them. Actual battery runtime needs applicable discharge, temperature, aging, and cutoff data. Capacitor voltage drop is the allowed change across the modeled capacitor, rather than a complete device minimum-voltage assessment.
Keep route geometry separate
For cable loss, retain the one-way distance, single-conductor resistance basis, temperature, and current path. The resistance reference explains the distinction from a complete network-segment loop. Pathway occupancy is another task: its calculator expects millimeter diameters and compares circular cross-sectional areas, not electrical losses or permitted fill.
Conclusion and sources
Keep the electrical boundary, device states, time intervals, and data sources with every total. Round only final displays to three decimal places. Current as charge per time, electrical power, and capacitance support these relationships. NIST SP 811 footnote 9 supplies the International Table Btu conversion. None supplies actual device currents, supply reserves, storage derating, or installation approval.